반응형
파이썬의 기본인 판다스 데이터를 표출하는데 기본적인 라이브러리 입니다.
A. st.dataframe
판다스 데이터를 불러와서 표출하는 라이브러리
st.dataframe(data=None, width=None, height=None, *, use_container_width=False, hide_index=None, column_order=None, column_config=None)
data : 표출할 데이터를 지정
width : 픽셀 단위로 폭 지정. 별도 지정하지 않으면 컬럼내 내용 크기에 따라 자동으로 맞춰짐
hide_index : 인덱스 표출 여부 지정. 기본은 None 으로 데이터에 index 있으면 표출됨
column_order : 표출하는 컬럼의 순서와 항목을 지정
column_config : 컬럼의 제목, 타입, 포맷을 지정
[예시]
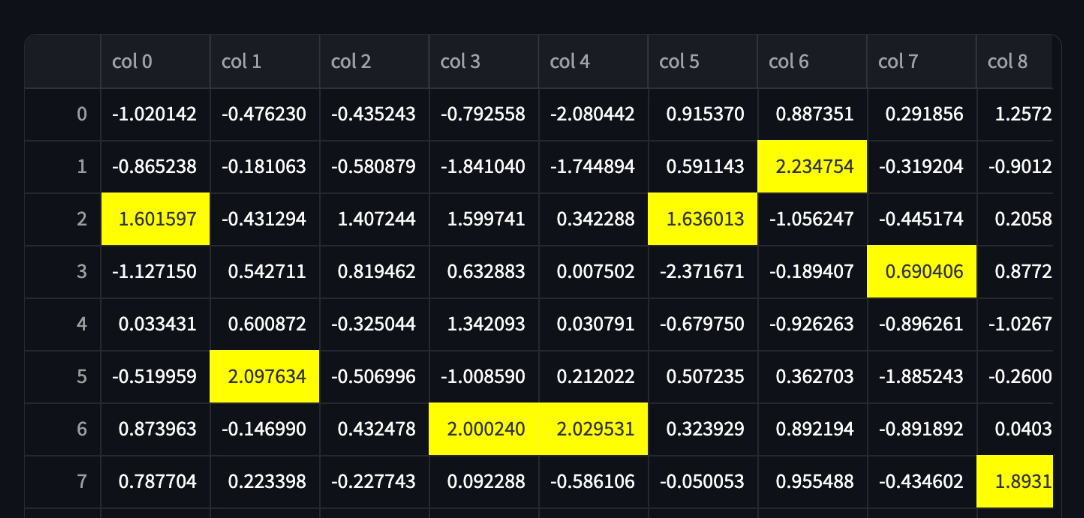
import streamlit as st
import pandas as pd
import numpy as np

df = pd.DataFrame(np.random.randn(10, 20), columns=("col %d" % i for i in range(20)))

st.dataframe(df.style.highlight_max(axis=0))
import random
import pandas as pd
import streamlit as st

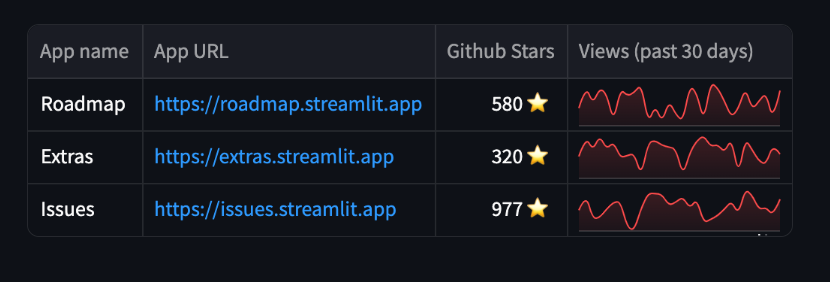
df = pd.DataFrame(
    {
        "name": ["Roadmap", "Extras", "Issues"],
        "url": ["https://roadmap.streamlit.app", "https://extras.streamlit.app", "https://issues.streamlit.app"],
        "stars": [random.randint(0, 1000) for _ in range(3)],
        "views_history": [[random.randint(0, 5000) for _ in range(30)] for _ in range(3)],
    }
)
st.dataframe(
    df,
    column_config={
        "name": "App name",
        "stars": st.column_config.NumberColumn(
            "Github Stars",
            help="Number of stars on GitHub",
            format="%d ⭐",
        ),
        "url": st.column_config.LinkColumn("App URL"),
        "views_history": st.column_config.LineChartColumn(
            "Views (past 30 days)", y_min=0, y_max=5000
        ),
    },
    hide_index=True,
)
element.add_rows
앞의 데이터의 하단에 데이터 합치기
import streamlit as st
import pandas as pd
import numpy as np

df1 = pd.DataFrame(np.random.randn(50, 20), columns=("col %d" % i for i in range(20)))

my_table = st.table(df1)

df2 = pd.DataFrame(np.random.randn(50, 20), columns=("col %d" % i for i in range(20)))

my_table.add_rows(df2)
# Now the table shown in the Streamlit app contains the data for
# df1 followed by the data for df2.
plot 에 데이터 추가 하기
# Assuming df1 and df2 from the example above still exist...
my_chart = st.line_chart(df1)
my_chart.add_rows(df2)
# Now the chart shown in the Streamlit app contains the data for
# df1 followed by the data for df2.
B. st.data_editor
데이터프레임 및 그 외 테이블형 데이터를 수정할 수 있는 위젯 라이브러리
st.data_editor(data, *, width=None, height=None, use_container_width=False, hide_index=None, column_order=None, column_config=None, num_rows="fixed", disabled=False, key=None, on_change=None, args=None, kwargs=None)
num_rows : 'dynamic' 으로 지정시 열을 추가 하거나 삭제할 수 있음. 기본은 'fixed' 로 수정할 수 없음
disabled : 기본인 'False'는 컬럼을 변경할 수 있는 지 지정하는 것으로 'True' 는 컬럼 수정 불가
[예시]
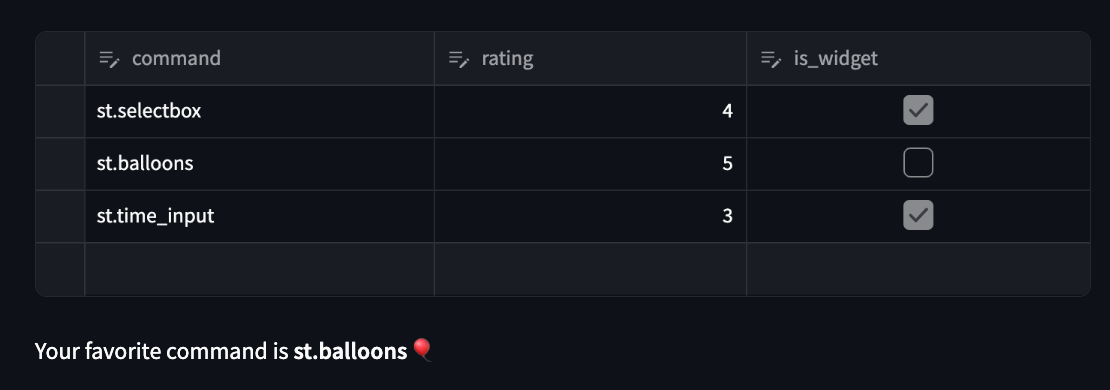
import streamlit as st
import pandas as pd

df = pd.DataFrame(
    [
       {"command": "st.selectbox", "rating": 4, "is_widget": True},
       {"command": "st.balloons", "rating": 5, "is_widget": False},
       {"command": "st.time_input", "rating": 3, "is_widget": True},
   ]
)
edited_df = st.data_editor(df, num_rows="dynamic")

favorite_command = edited_df.loc[edited_df["rating"].idxmax()]["command"]
st.markdown(f"Your favorite command is **{favorite_command}** 🎈")
import pandas as pd
import streamlit as st

df = pd.DataFrame(
    [
        {"command": "st.selectbox", "rating": 4, "is_widget": True},
        {"command": "st.balloons", "rating": 5, "is_widget": False},
        {"command": "st.time_input", "rating": 3, "is_widget": True},
    ]
)
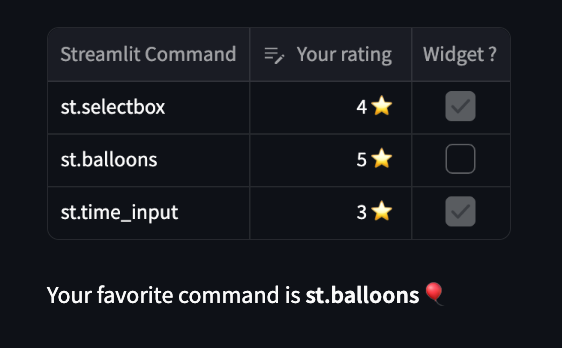
edited_df = st.data_editor(
    df,
    column_config={
        "command": "Streamlit Command",
        "rating": st.column_config.NumberColumn(
            "Your rating",
            help="How much do you like this command (1-5)?",
            min_value=1,
            max_value=5,
            step=1,
            format="%d ⭐",
        ),
        "is_widget": "Widget ?",
    },
    disabled=["command", "is_widget"],
    hide_index=True,
)

favorite_command = edited_df.loc[edited_df["rating"].idxmax()]["command"]
st.markdown(f"Your favorite command is **{favorite_command}** 🎈")
반응형
'파이썬(Python)' 카테고리의 다른 글
| [파이썬]Streamlit 활용 - 화면 레이아웃 (0) | 2024.04.13 |
|---|---|
| [파이썬]Streamlit 활용 - 파일업로드 (0) | 2024.04.13 |
| [파이썬]Streamlit 활용(5) - 기본 라이브러리 (0) | 2024.04.06 |
| [파이썬]Streamlit 활용(4) - 기본 라이브러리 (0) | 2024.03.09 |
| [파이썬]Streamlit 활용(3) - 기본 라이브러리 (1) | 2024.03.06 |


