스트림릿에서 차트를 사용하는 방법에 대해 알아 보겠습니다.
기본적으로 지원하는 차트로 영역(Area), 막대(Bar), 꺽은선(Line), 분산형(Scatter), 지역(Map) 종류가 있고,
외부 패키지를 지원하여 데이터의 성격이나 표출하고자 하는 방식에 따라 선택하여 사용하면 됩니다.
https://docs.streamlit.io/develop/api-reference/charts
Streamlit Docs
Join the community Streamlit is more than just a way to make data apps, it's also a community of creators that share their apps and ideas and help each other make their work better. Please come join us on the community forum. We love to hear your questions
docs.streamlit.io
1. 기본차트종류

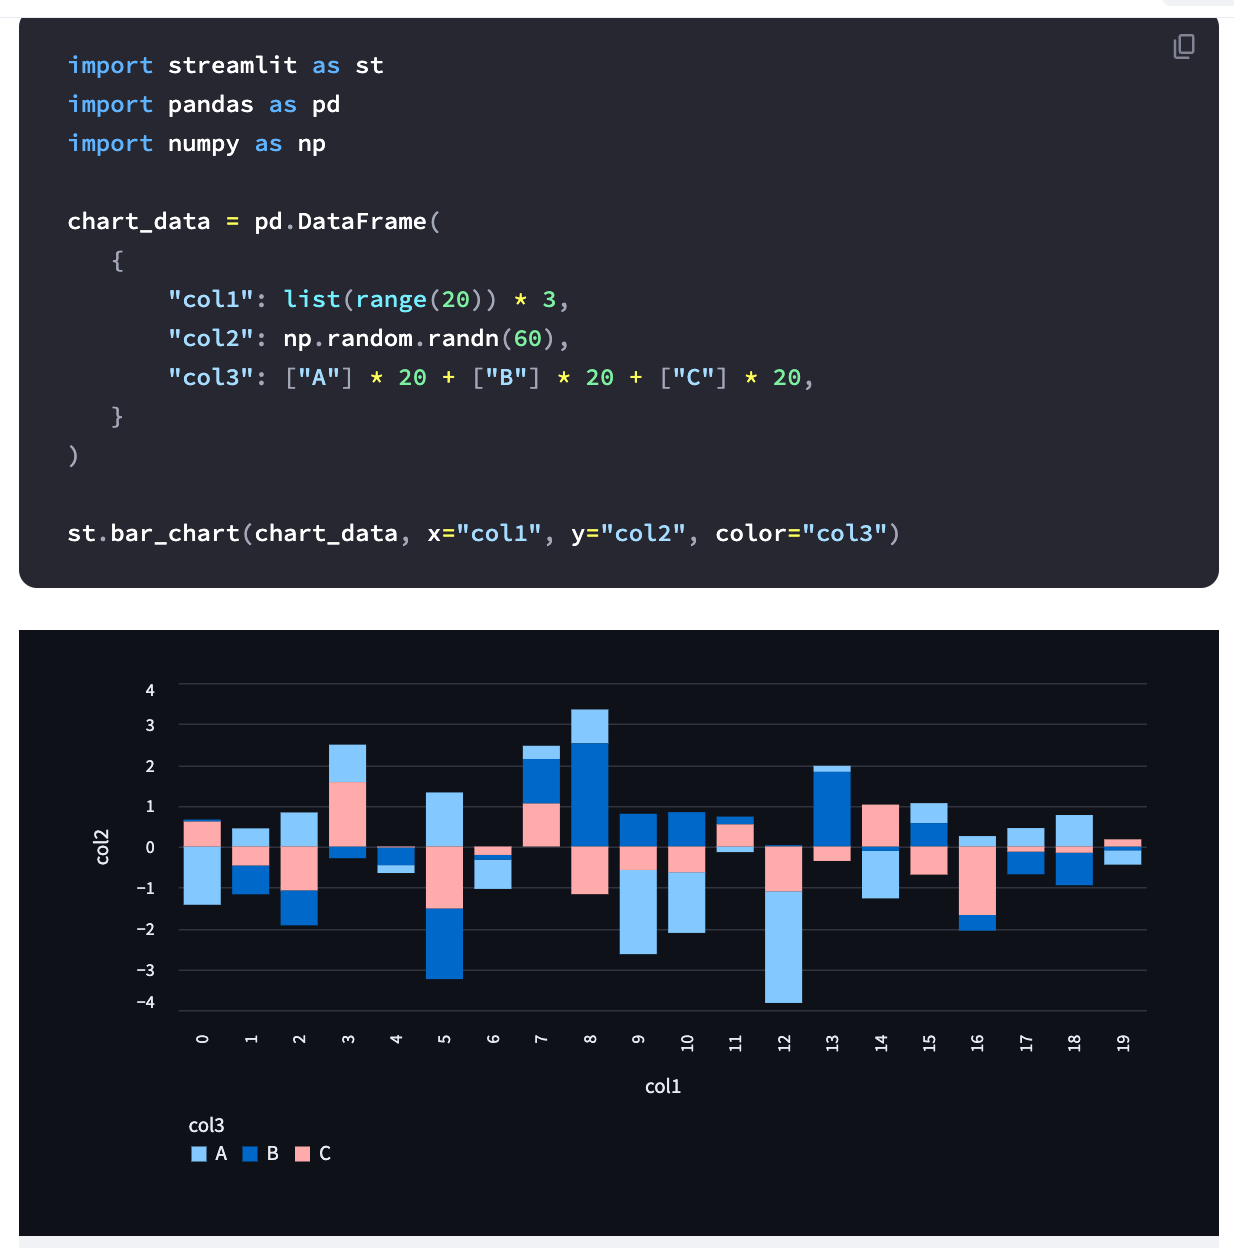
2. 기본 사용 예시
- 막대(Bar Chart)
st.bar_chart(data=None, *, x=None, y=None, color=None, width=0, height=0, use_container_width=True)
data : 표에 표출할 데이터 지정
x, y : 각 축에 사용할 컬럼 이름 지정, 지정하지 않으면 x 는 데이터의 index 값 사용, y는 x 축으로 지정되지 않은 컬럼들 표출
width, height : 차트의 크기를 픽셀(pixel)단위로 지정. 입력하지 않으면 화면 기본값으로 자동 셋팅됨

- 꺾은선, 영역, 분산형
- 상기 막대형과 사용 형식은 동일 합니다.
st.line_chart(data=None, *, x=None, y=None, color=None, width=0, height=0, use_container_width=True)
st.area_chart(data=None, *, x=None, y=None, color=None, width=0, height=0, use_container_width=True)
st.scatter_chart(data=None, *, x=None, y=None, color=None, size=None, width=0, height=0, use_container_width=True)
분산형의 크기(size)는 데이터 포인트 각각의 크기를 지정
- 지도(map) 차트
st.map(data=None, *, latitude=None, longitude=None, color=None, size=None, zoom=None, use_container_width=True)
latitude : 위도에 해당되는 컬럼 지정. 컬럼 지정 없으면 컬럼명 'lat', 'latitude', 'LAT', 또는 'LATITUDE' 컬럼으로 자동 셋팅
longitude : 경도에 해당되는 컬럼 지정. 컬럼 지정 없으면 컬럼명 'lon', 'longitude', 'LON', 또는 'LONGITUDE' 컬럼 자동 셋팅
import streamlit as st
import pandas as pd
import numpy as np

df = pd.DataFrame({
    "col1": np.random.randn(1000) / 50 + 37.76,
    "col2": np.random.randn(1000) / 50 + -122.4,
    "col3": np.random.randn(1000) * 100,
    "col4": np.random.rand(1000, 4).tolist(),
})

st.map(df,
    latitude='col1',
    longitude='col2',
    size='col3',
    color='col4')
3. 외부 패키지 사용하기
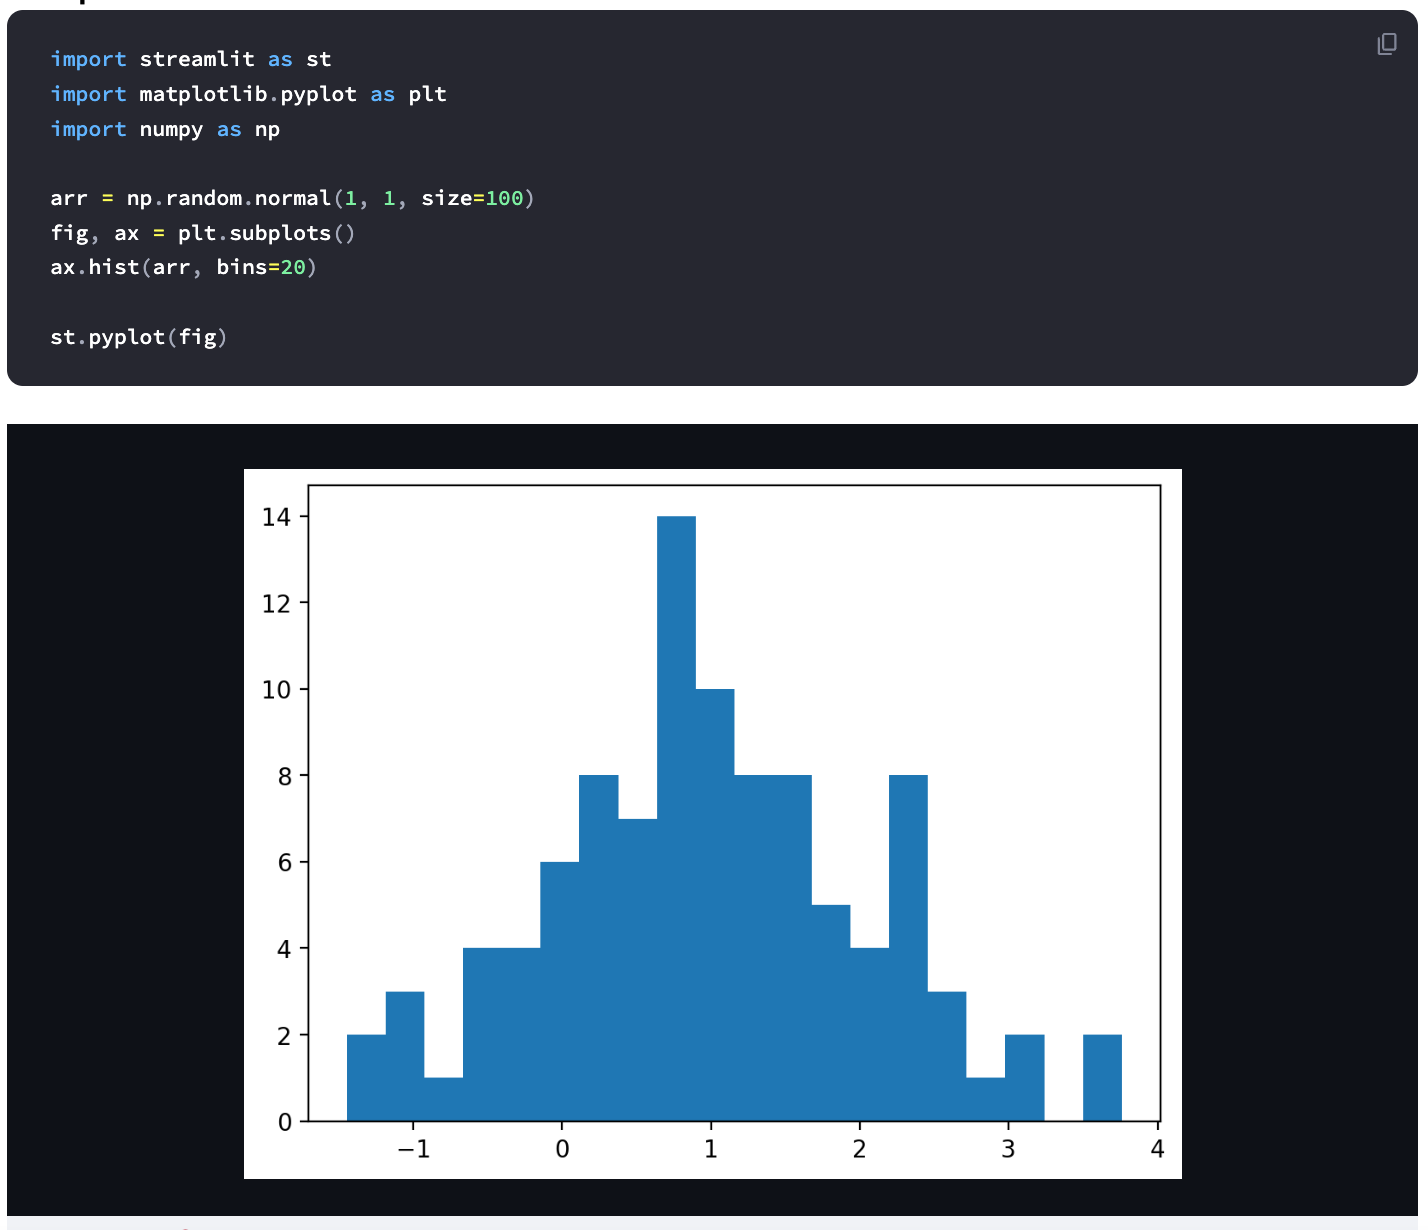
- matplotlib : 파이썬 언어 및 수학적 확장 NumPy 라이브러리를 활용한 차트 그리기 라이브러리로 스트림릿에서 사용방법은 다음과 같습니다.
st.pyplot(fig=None, clear_figure=None, use_container_width=True, **kwargs)

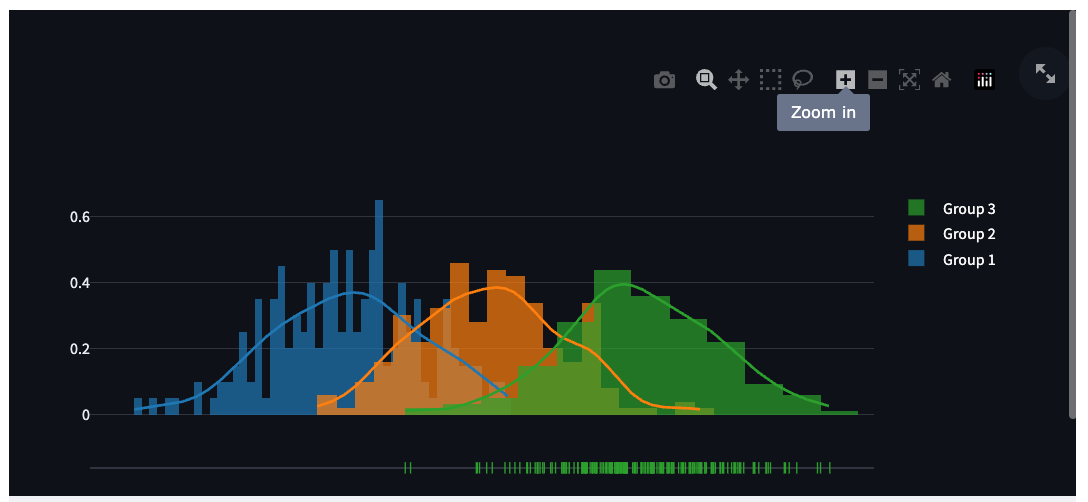
- Plotly : 인터렉티브한 시각화가 가능한 파이썬 그래픽 라이브러리로 사용법은 다음과 같습니다.
st.plotly_chart(figure_or_data, use_container_width=False, sharing="streamlit", theme="streamlit", **kwargs)
Interactive 한 시각화 가능하여 사용자가 시각화된 그래프를 쉽게 줌인, 줌아웃 및 툴팁을 활용한 데이터확인이 가능한 것으로
matplotlib과 가장 큰 차이점입니다.
import streamlit as st
import numpy as np
import plotly.figure_factory as ff

# Add histogram data
x1 = np.random.randn(200) - 2
x2 = np.random.randn(200)
x3 = np.random.randn(200) + 2

# Group data together
hist_data = [x1, x2, x3]

group_labels = ['Group 1', 'Group 2', 'Group 3']

# Create distplot with custom bin_size
fig = ff.create_distplot(
        hist_data, group_labels, bin_size=[.1, .25, .5])

# Plot!
st.plotly_chart(fig, use_container_width=True)
다음 포스트에서는 실제 데이터 사용 예시로 막대, 꺽은선 같이 한 차트에 표현하는 방법에 대해 알아보고자 합니다.
'파이썬(Python)' 카테고리의 다른 글
| [파이썬]Streamlit 활용 - 외부 공유하기 (0) | 2024.05.23 |
|---|---|
| [파이썬]Streamlit 활용 - Chart 예시 (0) | 2024.05.19 |
| [파이썬]Streamlit 활용 - 화면 레이아웃 (0) | 2024.04.13 |
| [파이썬]Streamlit 활용 - 파일업로드 (0) | 2024.04.13 |
| [파이썬]Streamlit 활용 - Data elements (0) | 2024.04.09 |


