반응형
실제 업무에서 사용했던 차트관련 예시 프로그램입니다.
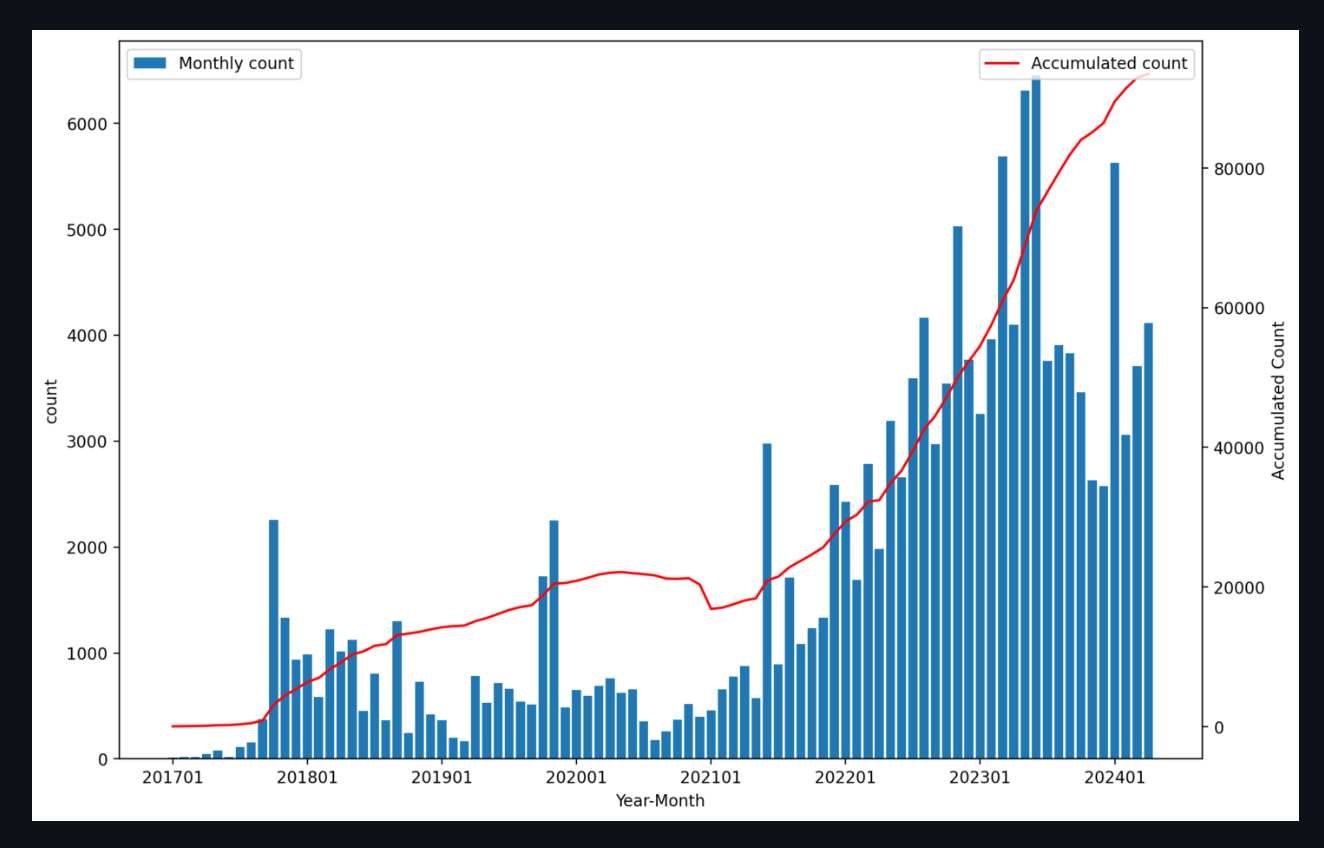
기본적인 막대차트, 꺾은선차트와 두개를 동시에 그리기 위한 방법입니다.
1. 기본 프로그램 구성
- 개요 - 2016년 ~ 2024년까지 신규 가입, 해지 고객에 대한 월별 데이터를 차트로 표현
- 검색조건 - 연도는 select_slider 활용하며, 기본은 2016 ~ 2024년 전체 선택이며, 연도 단위로 조정 가능하도록 함
- 데이터 선택 - 차트에 표시할 신규, 해지, 실가입자 데이터
2. 차트 구성
- 기본 차트 구성은 다음과 같이 간단하게 가능
- bar chart : st.bar_chart(month_sum_plot, x='기준월' , y= option)
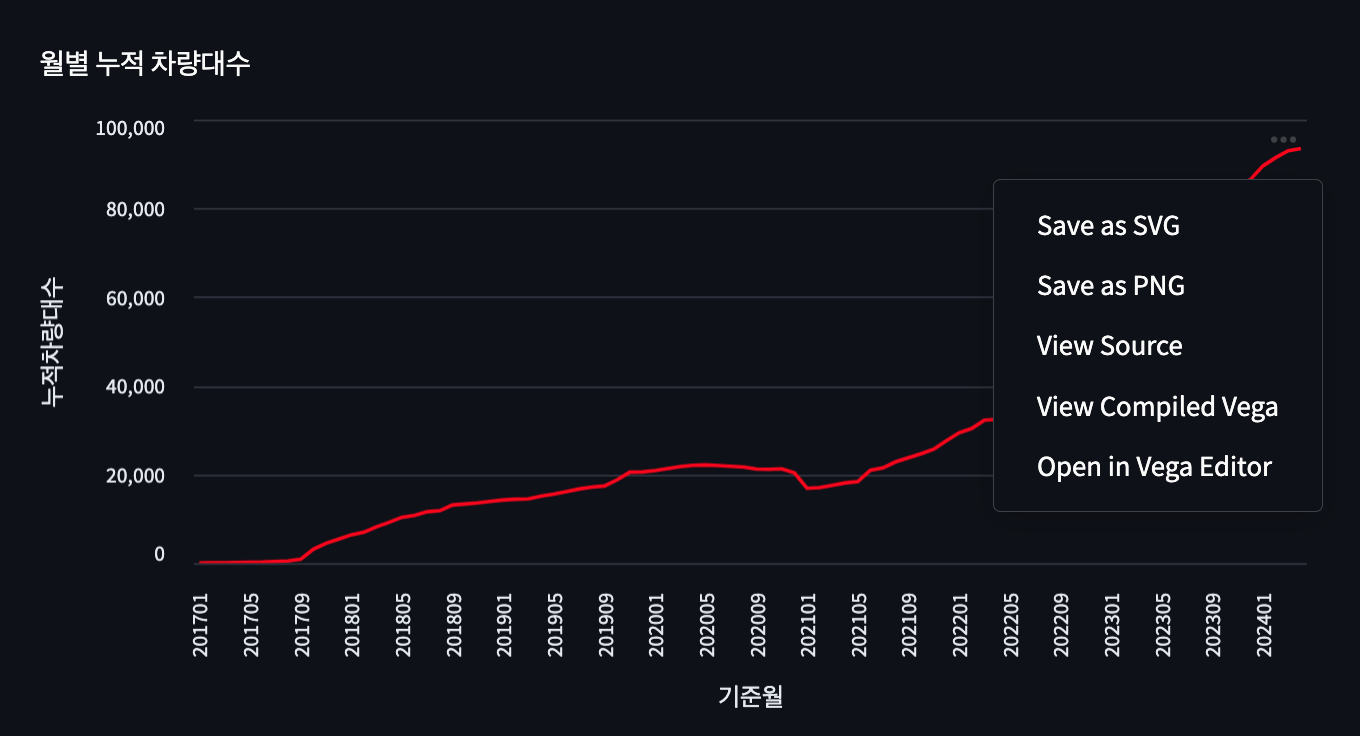
- line chart : st.line_chart(month_sum_plot, x='기준월' , y='누적차량대수', color='#F9051C', )
- 두 개 차트 동시 구성은 matplotlib 사용
- 기본 차트 사이즈 및 기본 x축 지정 : fig, ax1 = plt.subplots(figsize=(12,8))
- 두 번째 x축 지정 : ax2 = ax1.twinx()
- 기본 x 축 사용하는 bar chart 만들기
: ax1.bar(month_sum_plot['기준월'], month_sum_plot[option], label='Monthly count') - 두번째 x 축은 line chart 만들기 (bar chart 데이터 구분 위해 색상을 red 로 지정)
: ax2.plot(month_sum_plot['기준월'], month_sum_plot['누적차량대수'], label='Accumulated count', color='Red') - x축 눈금 지정 하기 (월데이터 표출시 데이터 겹치지 않도록 조정)
: ax1.set_xticks(np.arange(0, total_length+1, 12))
start_year, end_year = st.select_slider(
    '연도기간을 선택하세요',
    options=['2016', '2017', '2018', '2019', '2020', '2021', '2022', '2023', '2024'],
    value=('2016', '2024'))
st.write('선택된 기간: ', start_year, '년 -', end_year, ' 년')
st.caption('🖐🏻 시작과 끝을 동일연도로 선택시 해당 연도 데이터만 표출됩니다.')

option = st.selectbox(
    "신규장착, 탈거대수, 실장착대수 중에서 조회 데이터 선택",
    ("신규장착대수", "탈거대수", "실장착대수"),
    index=None,
    placeholder="종류 선택하기",
)

if option is not None:
    s_year = int(start_year)
    e_year = int(end_year)
    gap_year = e_year - s_year
    if gap_year == 0:
        if s_year == 2016:
            month_sum_plot = month_sum_list.iloc[0:2]
            st.dataframe(month_sum_plot)
        else:
            count = s_year - 2016 - 1
            start = 2 + count*12
            end = start + 12
            month_sum_plot = month_sum_list.iloc[start:end]
            st.dataframe(month_sum_plot)

        st.write('월별 '+ option)
        st.bar_chart(month_sum_plot, x='기준월' , y= option)
        st.write('월별 누적 차량대수')
        st.line_chart(month_sum_plot, x='기준월' , y='누적차량대수', color='#F9051C', )

        total_length = len(month_sum_plot.index)
        fig, ax1 = plt.subplots(figsize=(10,6))
        ax2 = ax1.twinx()
        ax1.bar(month_sum_plot['기준월'], month_sum_plot[option], label='Monthly count')
        ax2.plot(month_sum_plot['기준월'], month_sum_plot['누적차량대수'], label='Accumulated count', color='Red')
        ax1.set_xticks(np.arange(0, total_length+1, 12))
        ax1.set_xlabel('Year-Month')
        ax1.set_ylabel('count')
        ax2.set_ylabel('Accumulated Count')
        ax1.legend(loc='upper left')
        ax2.legend(loc='upper right')
        st.pyplot(fig)

    else:
        if s_year == 2016:
            count = 2+ gap_year * 12
            month_sum_plot = month_sum_list.iloc[0:count]
        else:
            count = s_year - 2016 -1
            start = 2 + (count)*12
            end = start + (gap_year+1)*12
            month_sum_plot = month_sum_list.iloc[start:end]

        st.write('월별 '+ option)
        st.bar_chart(month_sum_plot, x='기준월' , y=option)
        st.write('월별 누적 차량대수')
        st.line_chart(month_sum_plot, x='기준월' , y='누적차량대수', color='#F9051C', )

        total_length = len(month_sum_plot.index)
        fig, ax1 = plt.subplots(figsize=(12,8))
        ax2 = ax1.twinx()
        ax1.bar(month_sum_plot['기준월'], month_sum_plot[option], label='Monthly count')
        ax2.plot(month_sum_plot['기준월'], month_sum_plot['누적차량대수'], label='Accumulated count', color='Red')
        ax1.set_xticks(np.arange(0, total_length+1, 12))
        ax1.set_xlabel('Year-Month')
        ax1.set_ylabel('count')
        ax2.set_ylabel('Accumulated Count')
        ax1.legend(loc='upper left')
        ax2.legend(loc='upper right')
        st.pyplot(fig)
3. 차트 결과 보기


👉 chart 는 오른쪽 상단의 ' ... ' 선택시 차트관련 메뉴가 나옴
이미지로 저장하거나 소스 내용을 확인할 수 있음

반응형
'파이썬(Python)' 카테고리의 다른 글
| [파이썬]Streamlit - Git LFS 사용하기 (0) | 2024.06.12 |
|---|---|
| [파이썬]Streamlit 활용 - 외부 공유하기 (0) | 2024.05.23 |
| [파이썬]Streamlit 활용 - Chart (0) | 2024.05.18 |
| [파이썬]Streamlit 활용 - 화면 레이아웃 (0) | 2024.04.13 |
| [파이썬]Streamlit 활용 - 파일업로드 (0) | 2024.04.13 |


